


Tuesday
EYFS
Organising Data
LC :To collect data
LC: To create graphs
Key Vocabulary
Data - Information we collect to learn something.
Graphs - A picture that helps us understand numbers and data.
Bar chart - A graph with bars to show how many.
Which is your favourite ice cream flavour?
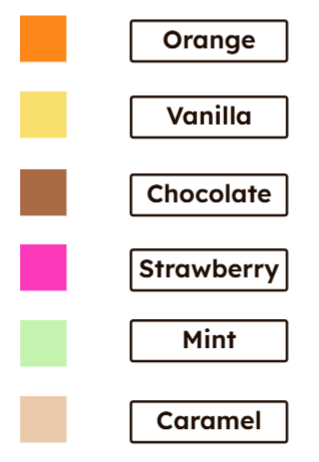
We are going to gather data for our class and represent that data in the form of a graph.
Lets collect the data! We will use coloured cubes to help us keep track of our results.
We will transfer our data into a digital format using seesaw.

Look at this example bar chart, which flavour do most children enjoy? Which flavour is liked the least? How many children like mint?
Year 1
Programming animations - Project design
LC - To design the parts of a project
I can choose appropriate artwork for my project
I can decide how each sprite will move
I can create an algorithm for each sprite

